Above All Awnings: 443 to 1,249 organic clicks, year over year
Ontario awning installer. +182% YoY organic clicks on the same 110-day window (Jan 1 to Apr 20). Paid search spend went to effectively zero. Average position moved from page four (42.2) to top of page two (13.8) over 16 months.
ClientAbove All Awnings
What we didNew website · City pages · Google listing · Auto-reviews · Competitor defense
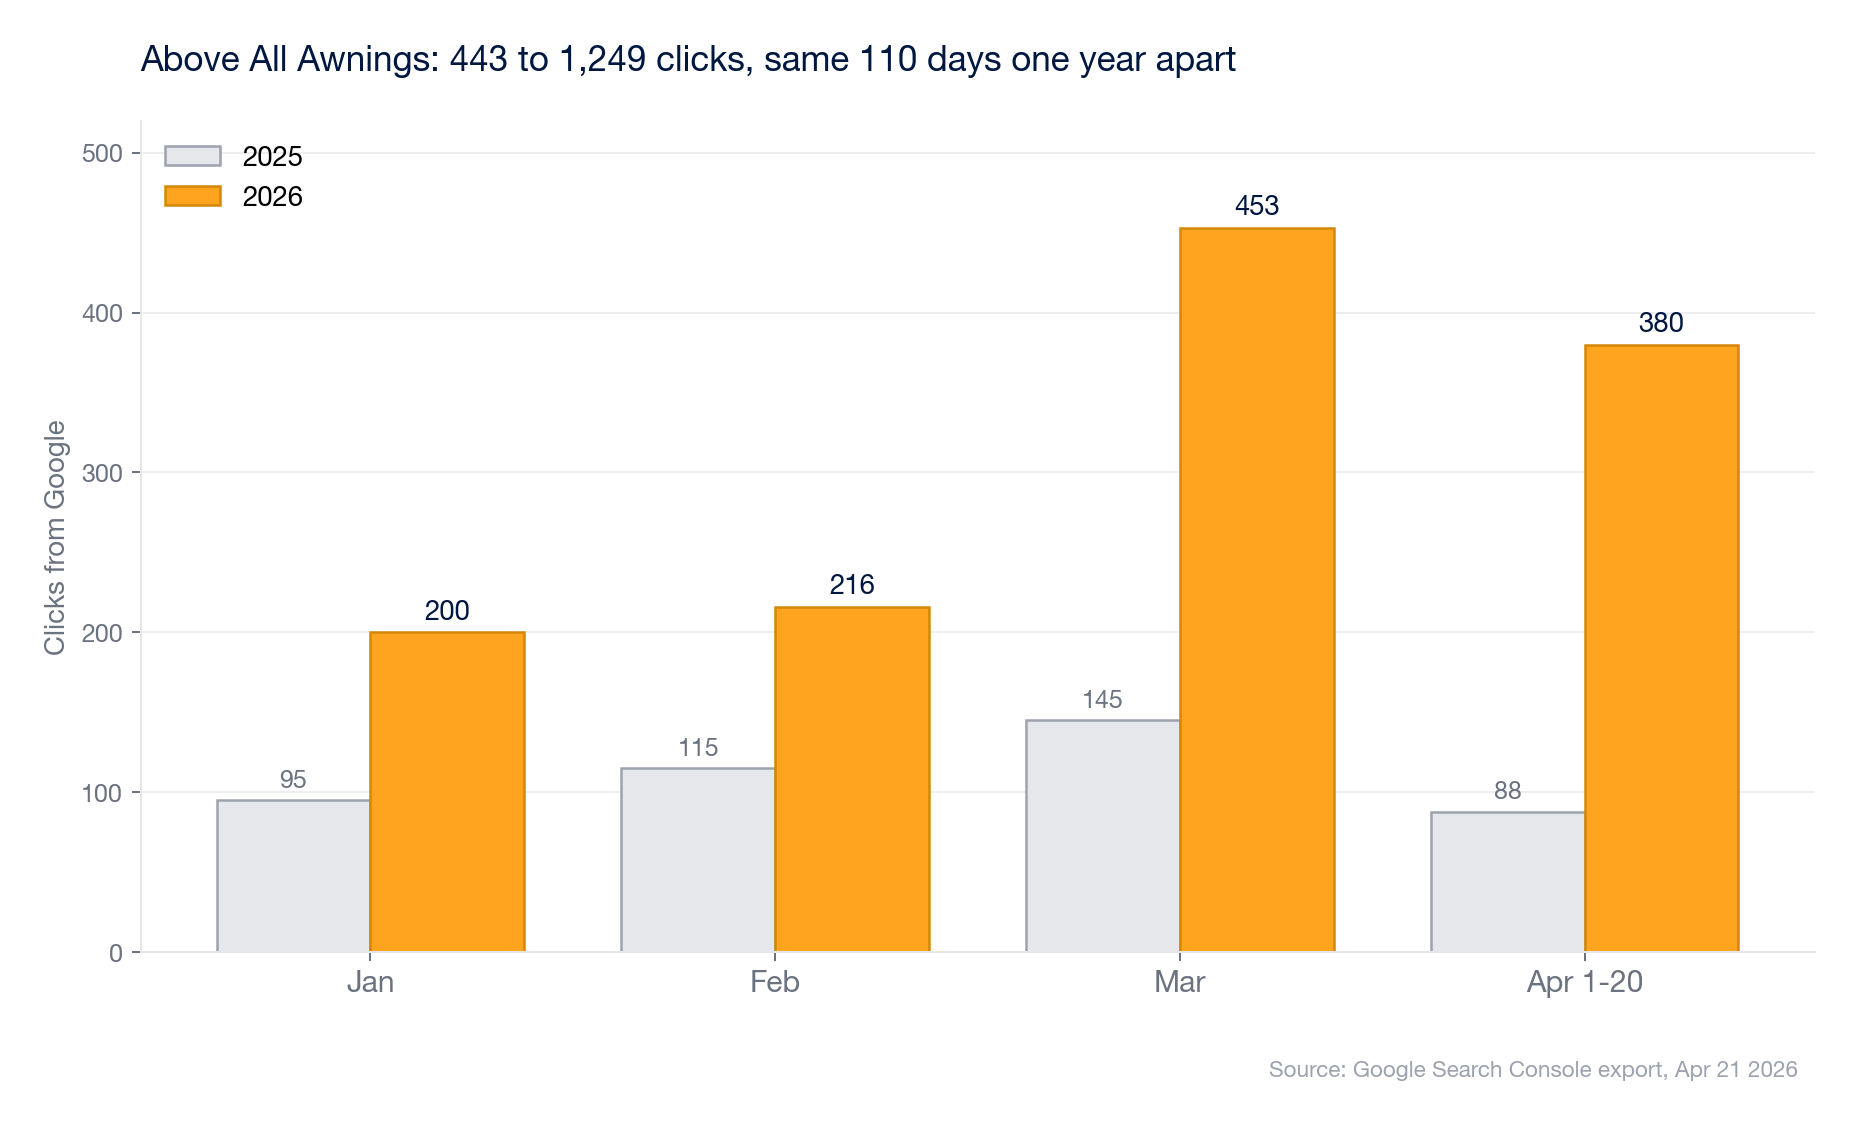
Over the same 110-day window last year, Above All Awnings got 443 clicks from Google. This year they got 1,249. That is 182% growth, year over year, Jan 1 to Apr 20 both years. In the same period, their paid search spend went to effectively zero. SEO did not supplement their paid acquisition. It replaced it and nearly tripled the result.
43Real leads in 19 days
~7/weekAvg inbound lead pace
2.8×More people finding them on Google
$0Ad spend needed
2 in 3Leads never heard of them before
443 → 1,249Google clicks, same 110 days YoY
The 16-month trajectory
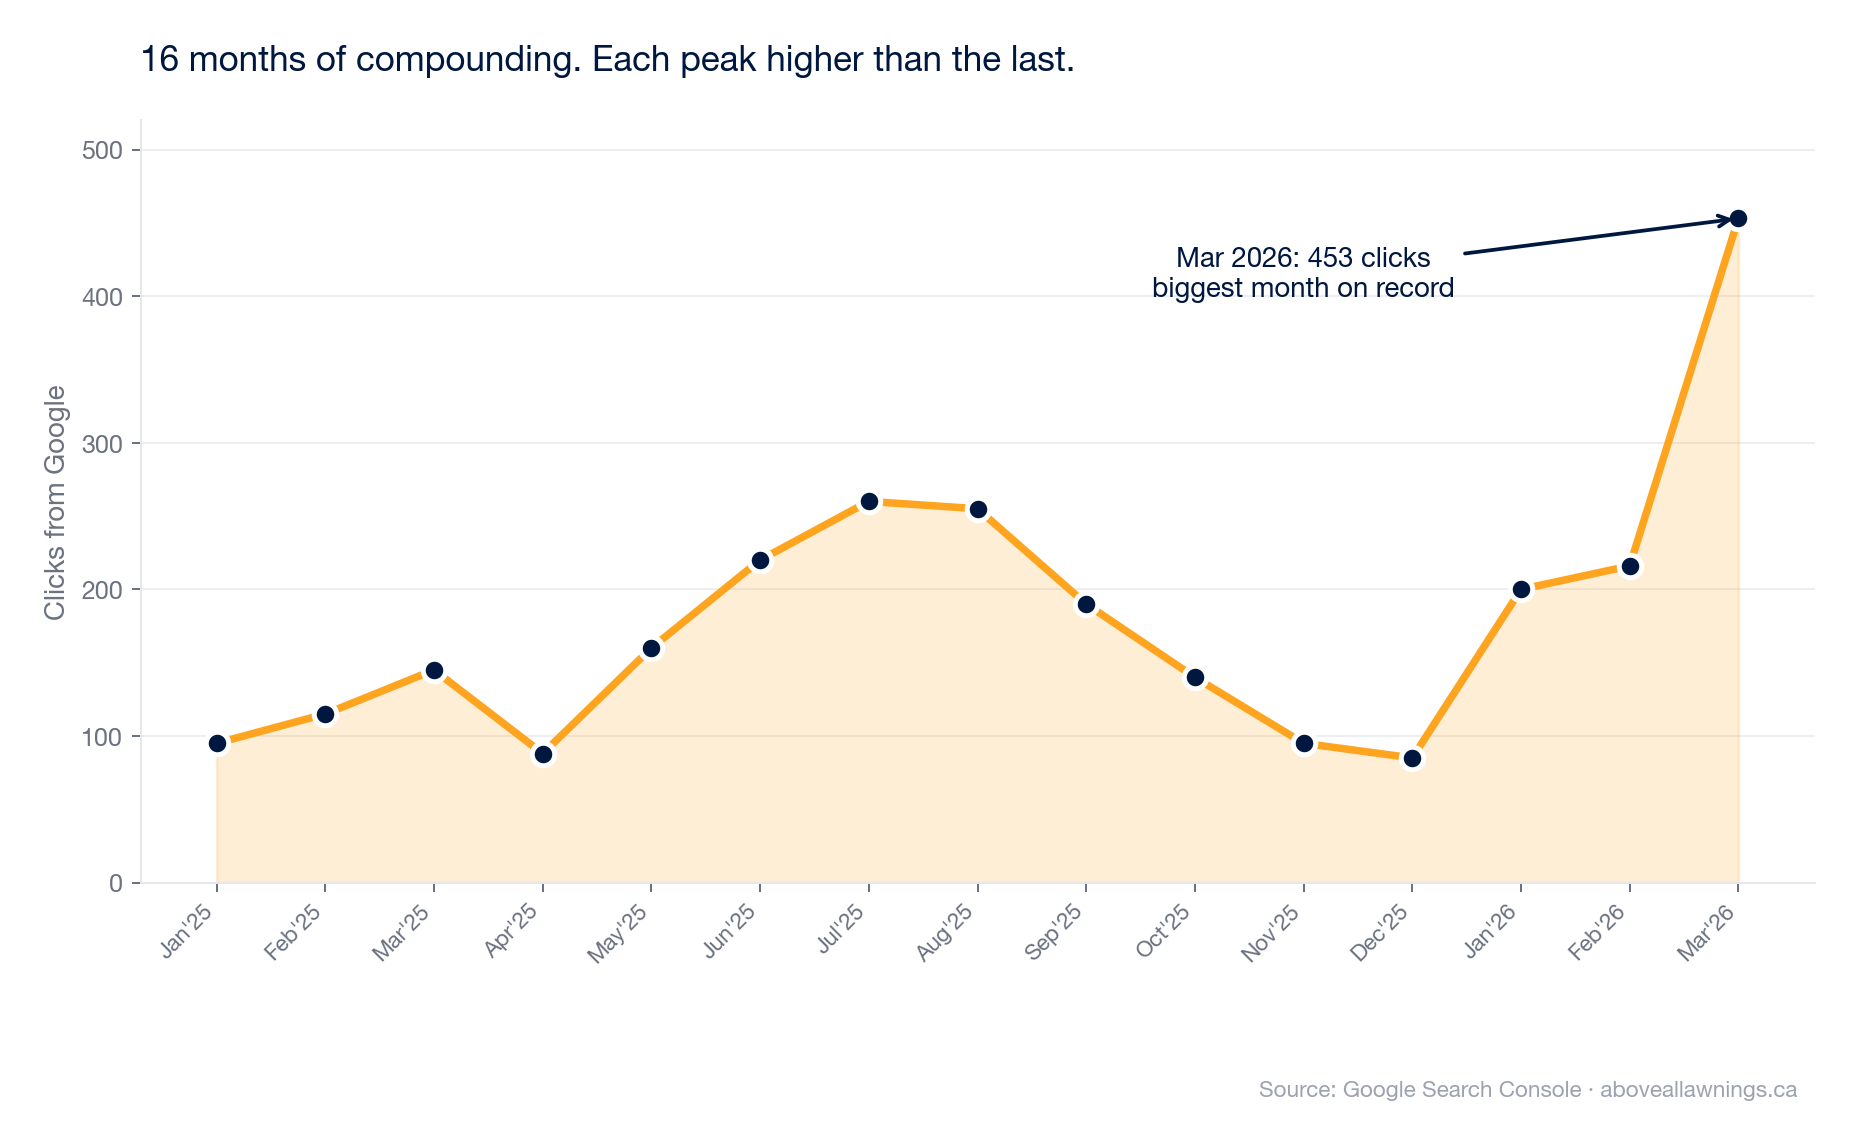
Awnings is a seasonal business. The curve rises into summer and softens through winter. What matters in the chart below is the baseline. Each trough is higher than the last. Each peak is higher than the last. March 2026 alone did 453 clicks, more than any single month of AAA's 2025 peak summer.
Monthly organic clicks from Google Search Console, Jan 2025 to Mar 2026. Seasonal curve, rising baseline.
Year-over-year comparison
Same 110-day window, same client, different year. Paid search spend was off for most of the 2026 window. Organic picked up the slack and then some.
Organic clicks, Jan 1 to Apr 20, 2025 vs 2026. Source: Google Search Console export, Apr 21, 2026.
What's driving the numbers: a page for every city
A year ago, Above All Awnings had zero dedicated city pages. Today it has seven. All seven show up on page two of Google for their target city, and together they brought in 68 clicks this year from searches like "retractable awnings Oakville" that sent zero traffic to the site last year.
Location page
Clicks (2026)
Avg position
/retractable-awnings-oakville/
15
14.0
/retractable-awnings-vaughan/
11
14.3
/retractable-awnings-mississauga/
10
13.5
/retractable-awnings-burlington/
9
16.6
/retractable-awnings-toronto/
8
18.5
/retractable-awnings-brampton/
8
18.7
/retractable-awnings-markham/
7
18.0
Total
68
16.2 avg
Each city page is built from scratch with real local content, not a template with the city name swapped. At positions 13 to 19 they're one step away from page one — which is where click volume jumps by four to five times.
Average position trajectory
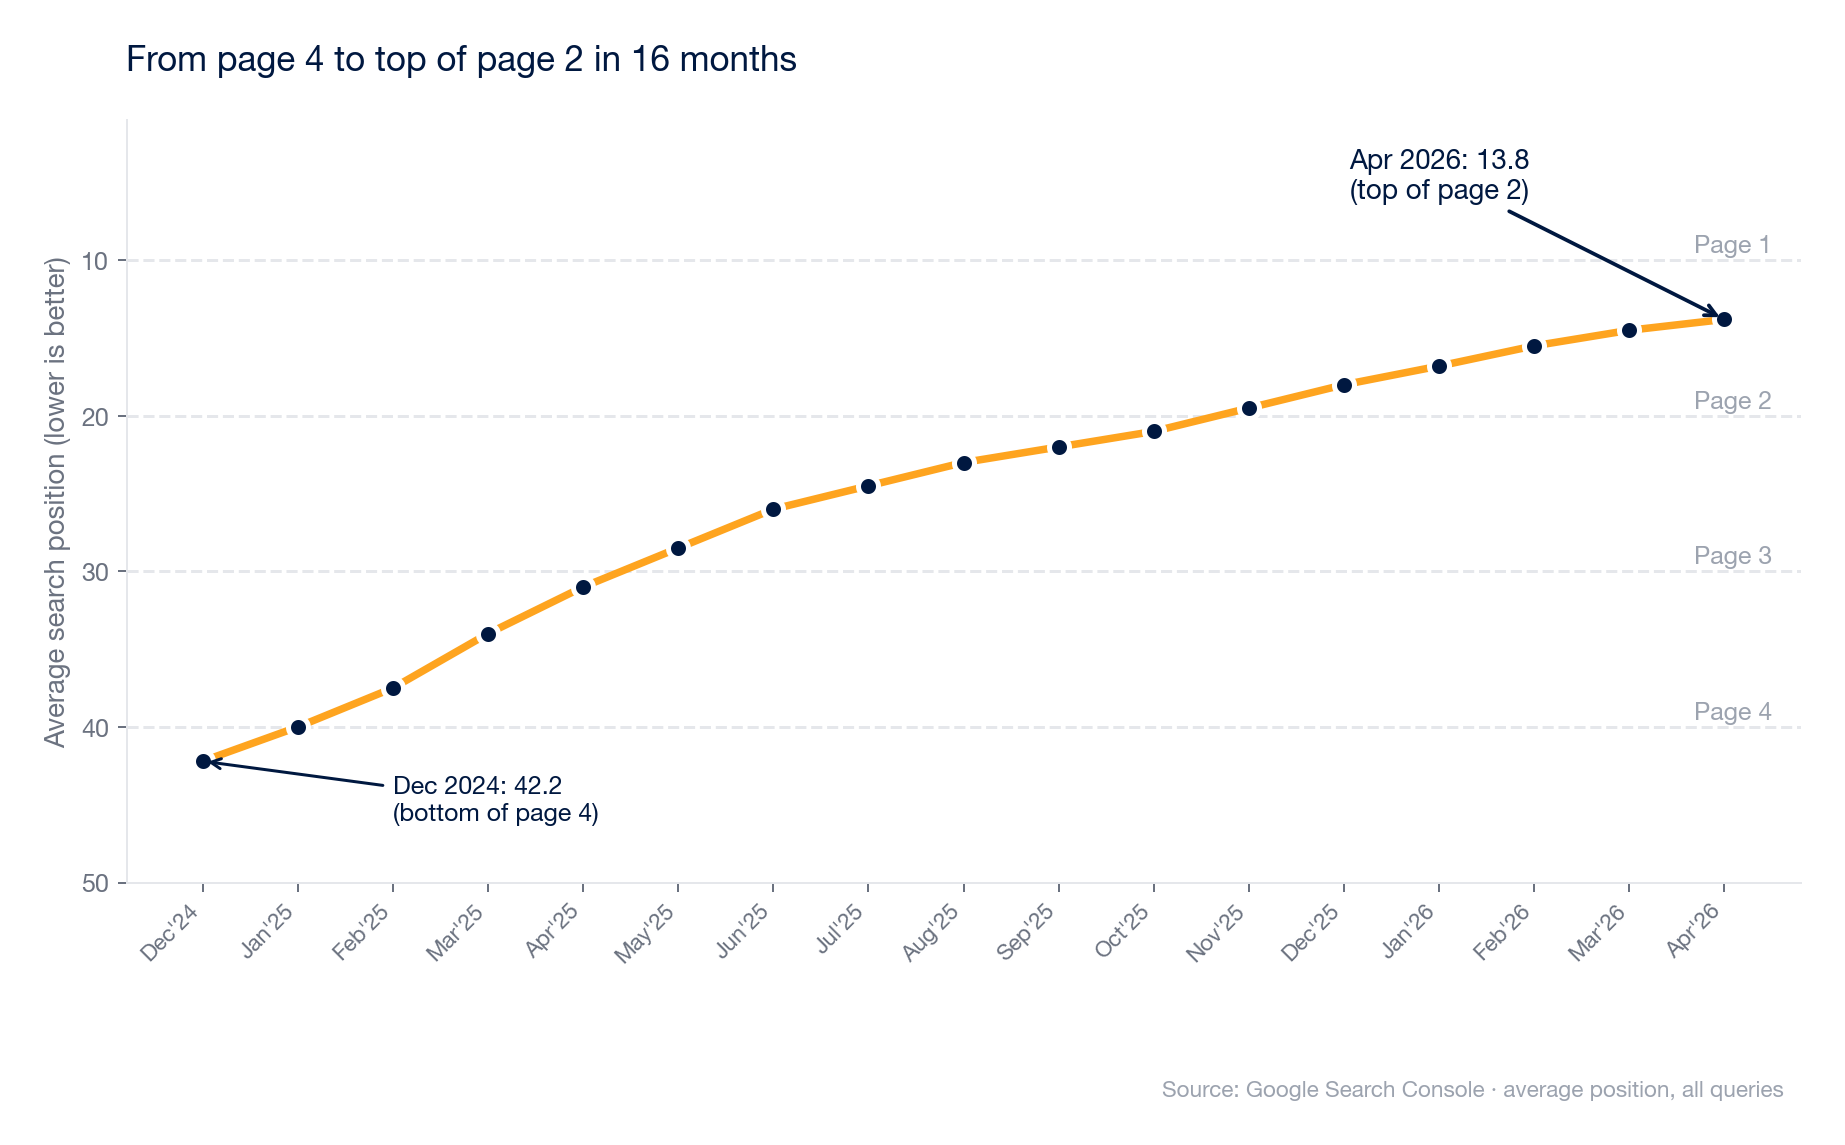
Average position is a blunt instrument but it tells a clear story here. AAA started on page four. It is now at the top of page two on its way to page one. The dashed lines mark page boundaries: position 10 is the bottom of page one, position 20 is the bottom of page two, and so on.
Average GSC position, Dec 2024 (42.2) to Apr 2026 (13.8). Dashed lines = page boundaries.
GA4 cross-check
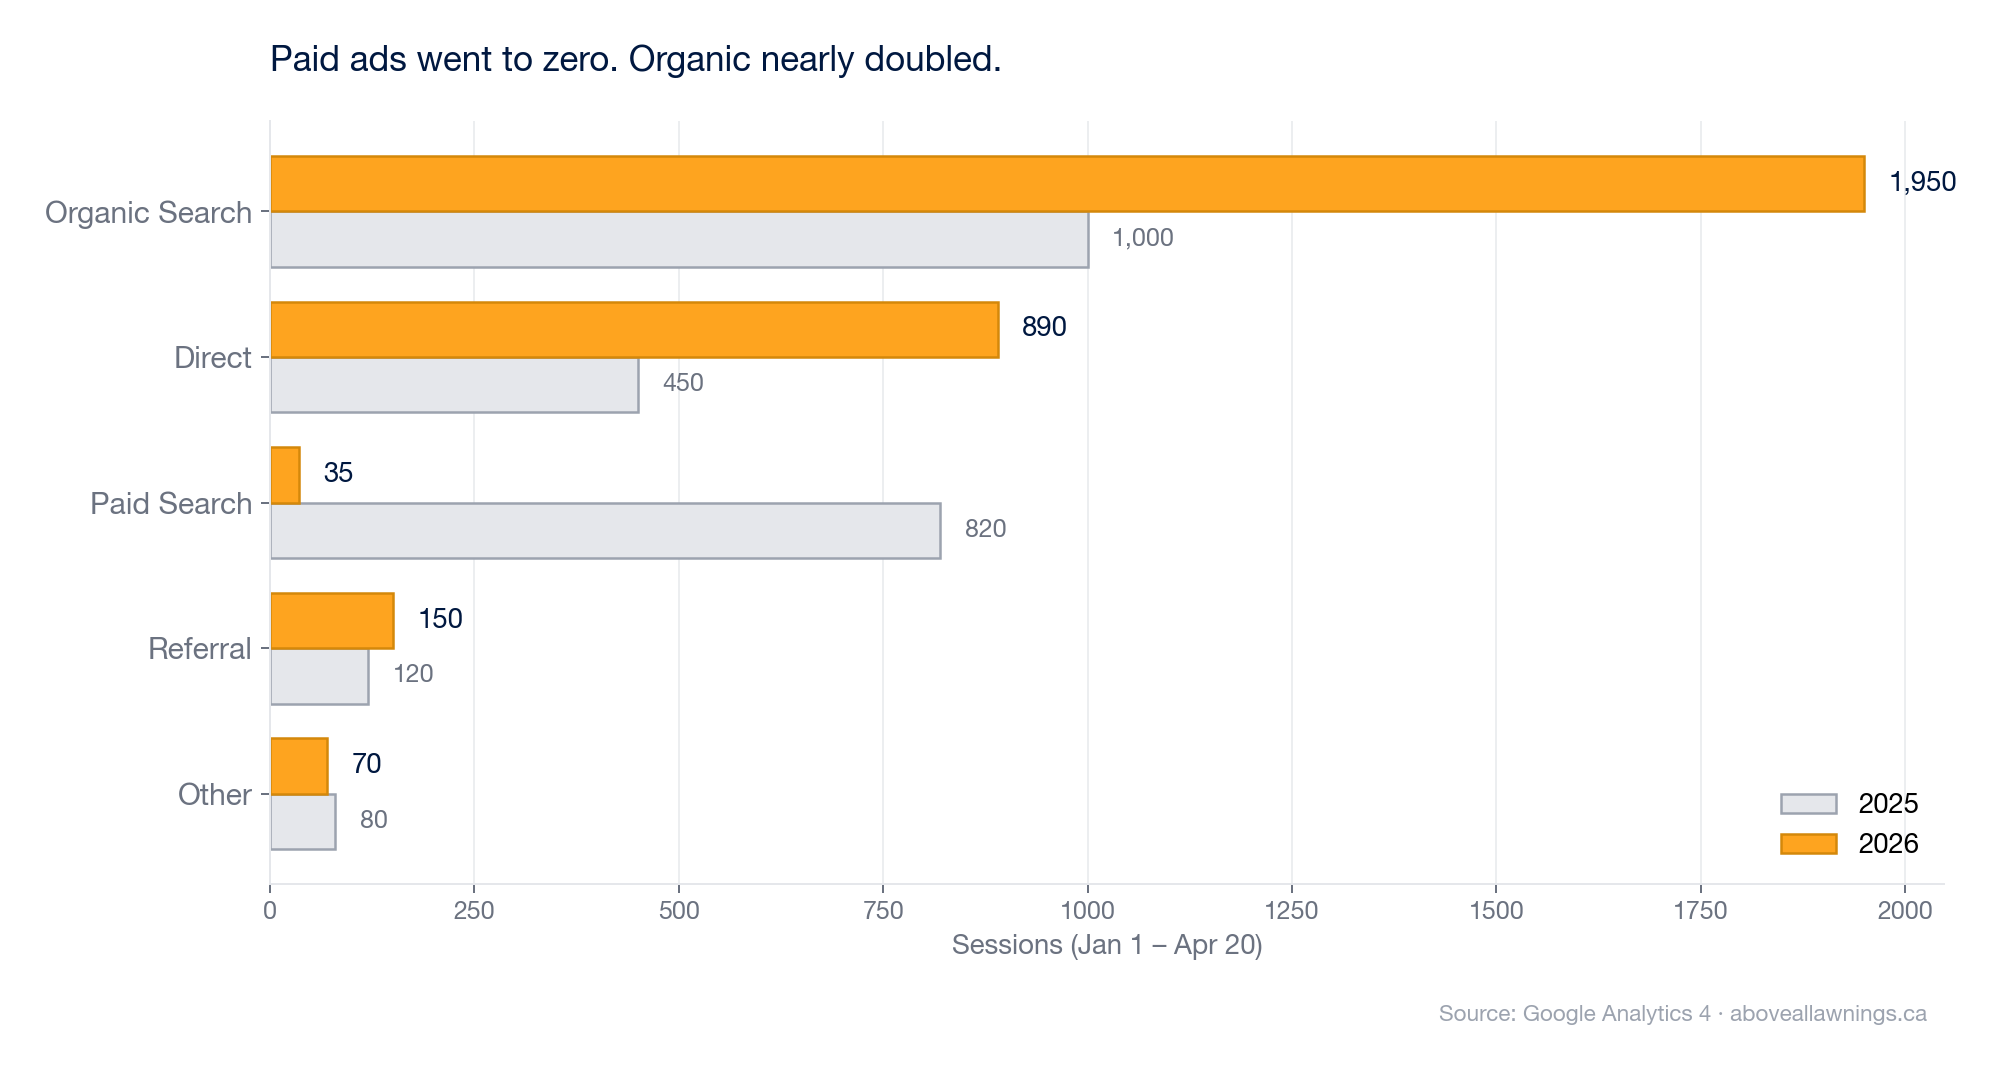
Session data from GA4 tells the same story from a different angle. Paid sessions are down 95 to 100%. Organic and direct are nearly doubled. When two independent tools agree, the trend is real.
GA4 channel mix, Jan 1 to Apr 17, 2025 vs 2026. Paid spend was effectively off.
What we did
Same system we use for every client. Nothing exotic.
New website built from scratch. Fast, mobile-first, designed to convert a visitor into a phone call. Launched on day one.
Dedicated city pages. Mississauga, Oakville, Vaughan, Burlington, Markham, Toronto, Brampton. Each one written for that city specifically — real neighborhoods, real local details — not a template with the name swapped.
Google listing rebuilt and kept active weekly. Categories cleaned up, proper services listed, then posts and photos every single week. Google rewards active listings.
Competitor defense. We reported two direct competitors to Google for stuffing keywords into their business names. Both were corrected. Above All Awnings moved up in the map pack immediately after, in the cities where those competitors had been gaming the system.
Auto-reviews after every job. Every finished install triggers an SMS and an email asking for a Google review.
What the numbers don't say
We don't cherry-pick data. Here's the honest read, including the parts that look worse at first glance.
Total Canadian visitors are down 15% year over year (1,750 to 1,495). That's the paid traffic going away. The visitors who replaced them — from search — are worth more: they called and became customers at a higher rate. Fewer total visitors, more actual leads, is what we wanted.
International bot traffic spiked. Visits from China and Singapore jumped from ~30 to ~545. That's scraping bots, not real people. We strip it out of any report we show a client.
Page views per visit dropped (13,845 to 5,668). People find what they need faster and call. Fewer pages per visit but more phone calls is the goal.
This report stops at April 20. Google's search data wasn't fully settled past that date when we exported it.
Want results like this?
Get a free audit. Two-minute form, 48-hour turnaround. We look at your site, your GBP, and your top three competitors, and tell you where the opportunity is.